REACH Workshop 2026

Repurposing Sponsored Research Data into Actionable Intelligence

A 2-hour hands-on workshop. Build research collaboration networks from sponsored research data using Gephi, and learn the fundamental concepts and statistical metrics behind them.

Presenter
Robert Pilgrim, Ph.D.
Format
2 hours · Hands-on · Gephi
Contact
rpilgrim@uark.edu
Get the materials →
Workshop Overview

Watch before you come

A short overview of what we'll build together.

Outcomes from Workshop

What you'll take away

Build a network

Be able to build a research collaboration network from sponsored research data.

Learn the concepts

Introduce some fundamental concepts around networks and statistical metrics.

Workshop Contents

What we'll cover

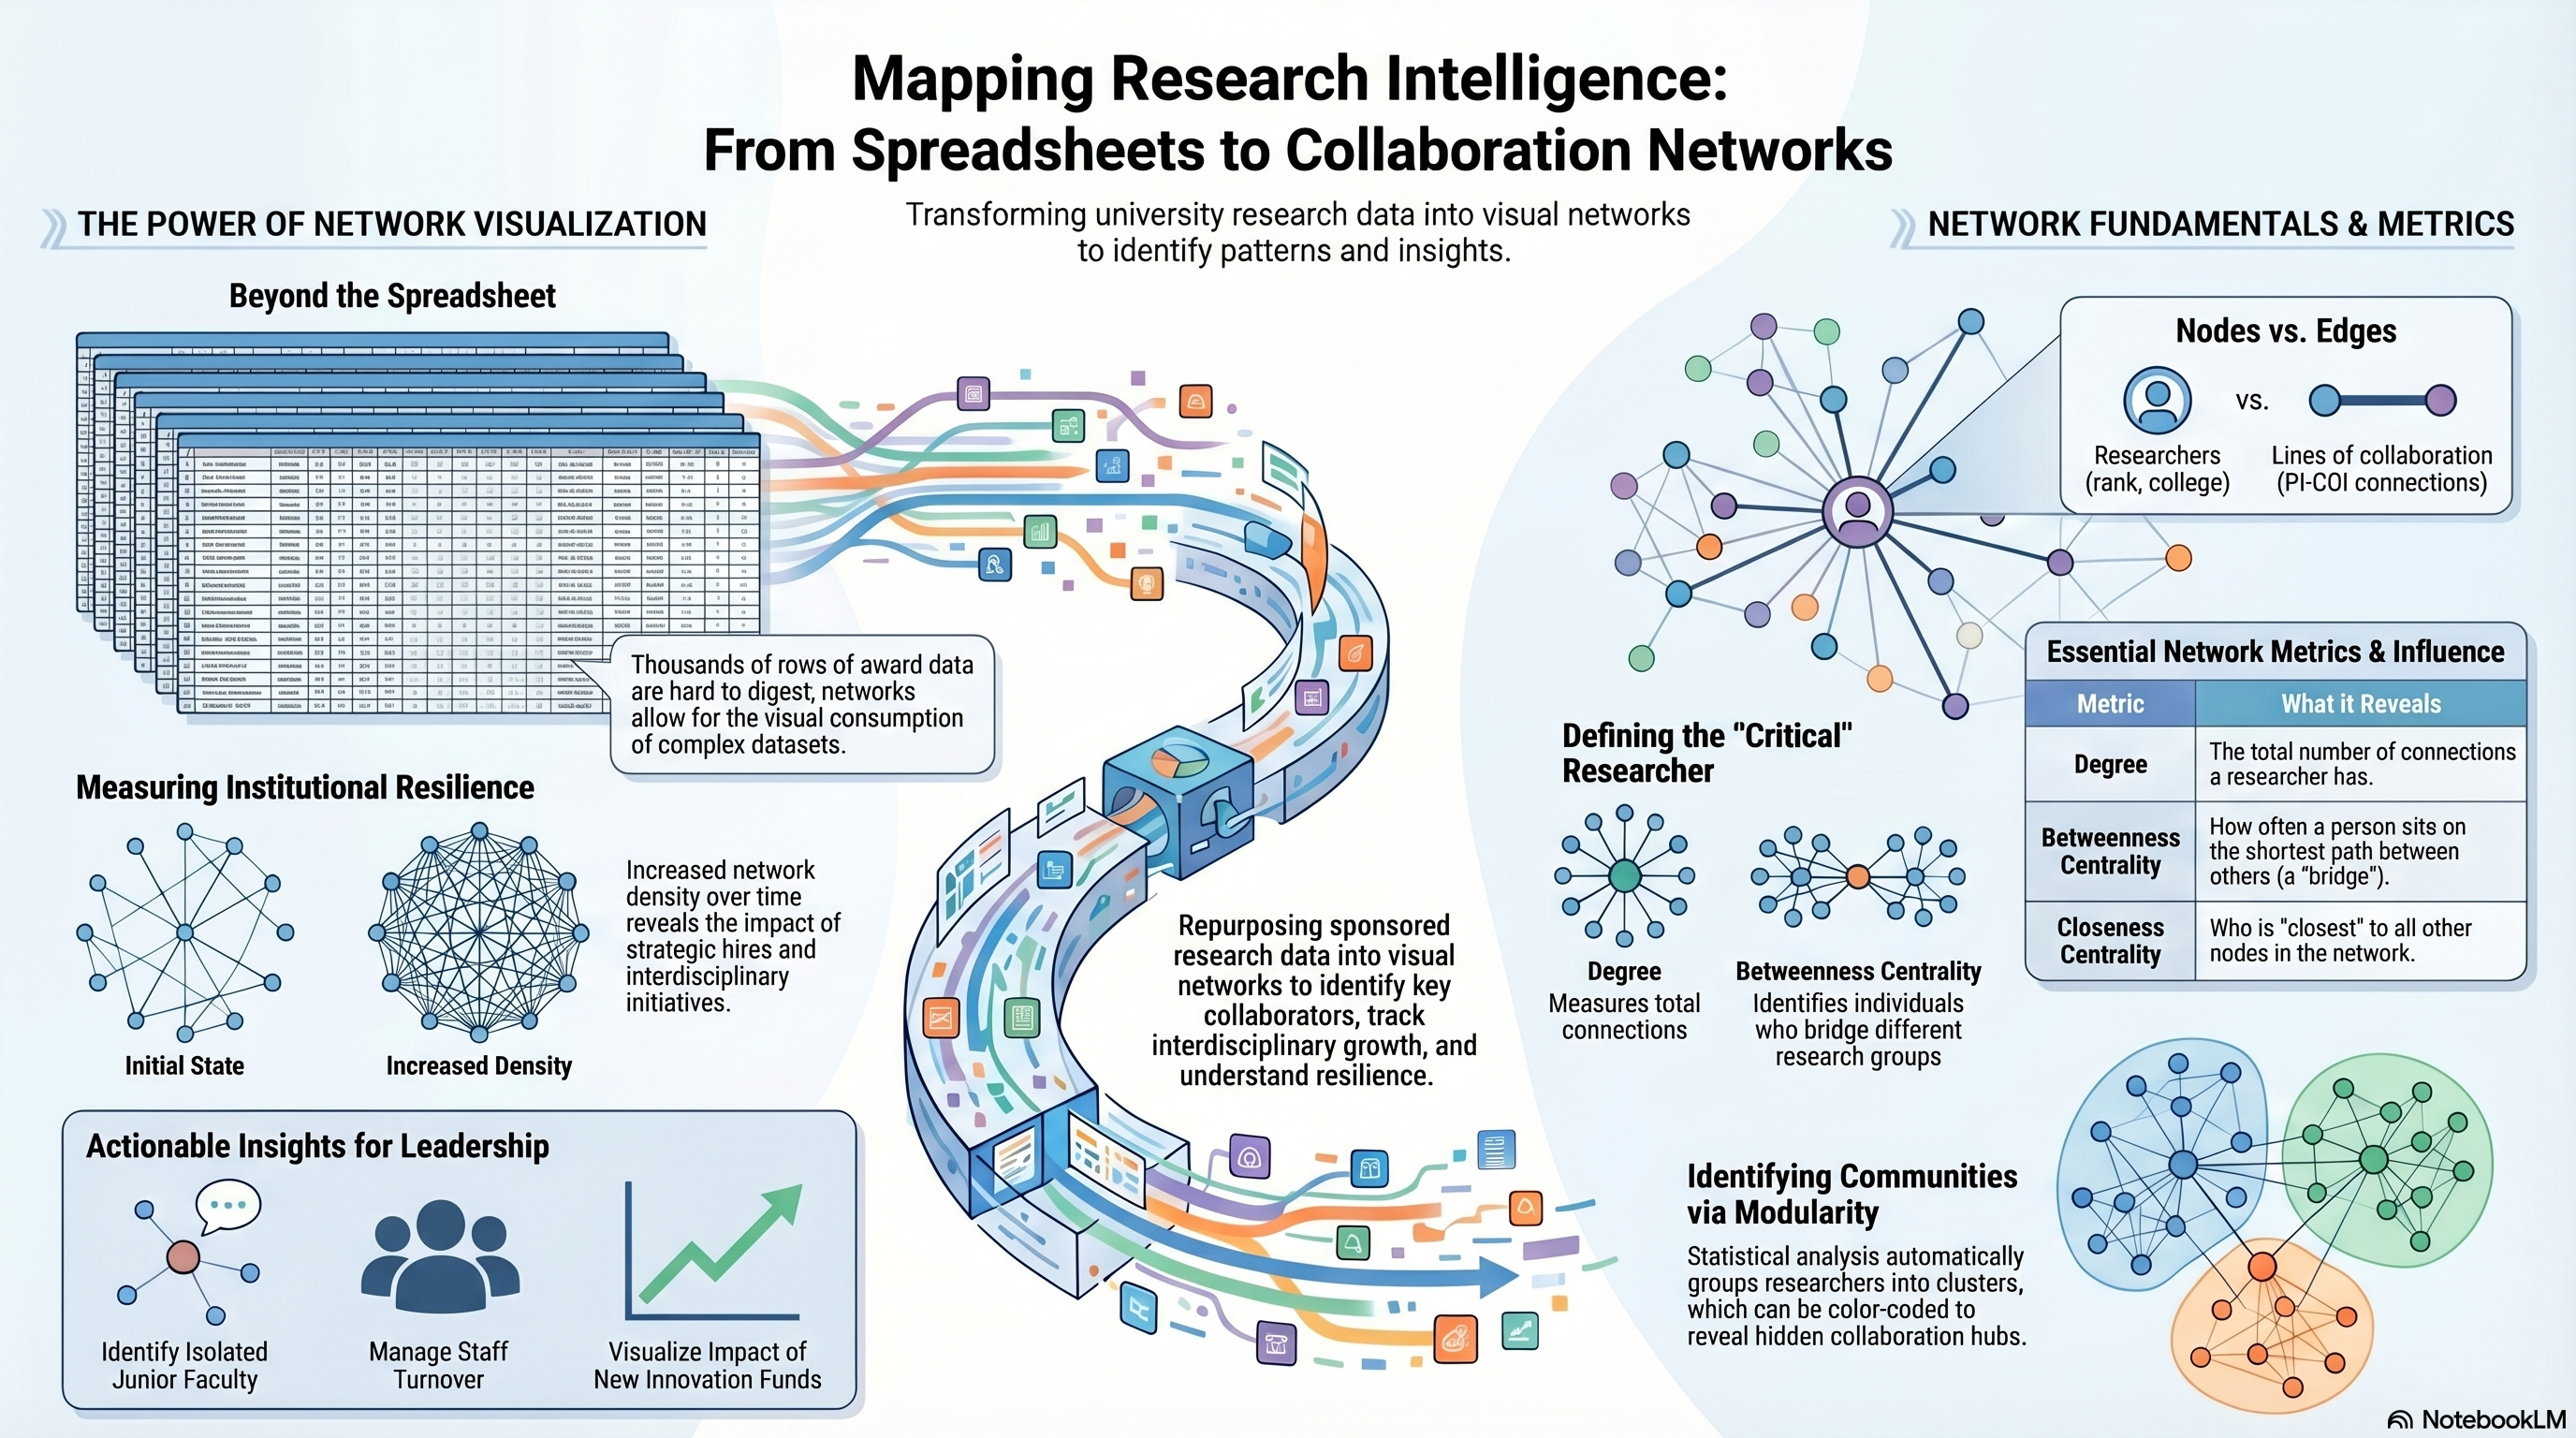
Introduction · Networks 101 · Gephi Overview

The post-it wall analogy for research networks. Why sponsored research data works. A walkthrough of the Gephi interface.

Project-01: Our First Network

Load data, build a simple network, add names, run statistics, apply filters.

Network Metrics · Introduction & Learn with AI

Degree, betweenness centrality, closeness centrality, modularity. Guided learning through an AI chatbot tailored to your role.

Project-02: Research Communities

Automatic research group detection using modularity. Coloring the network, sizing by degree, using the Data Laboratory.

Exporting Your Network · Dynamic Networks

Move from Overview to Preview, tune export settings, produce a searchable PDF. A note on dynamic (time-based) networks.

Show me the network stats

Review the underlying metrics table in the Data Laboratory.

Project-03: Another Network

Use your own data, or use the provided FY21 and FY21–FY23 federal proposal datasets. Compare and contrast the two.

Workshop mind map preview
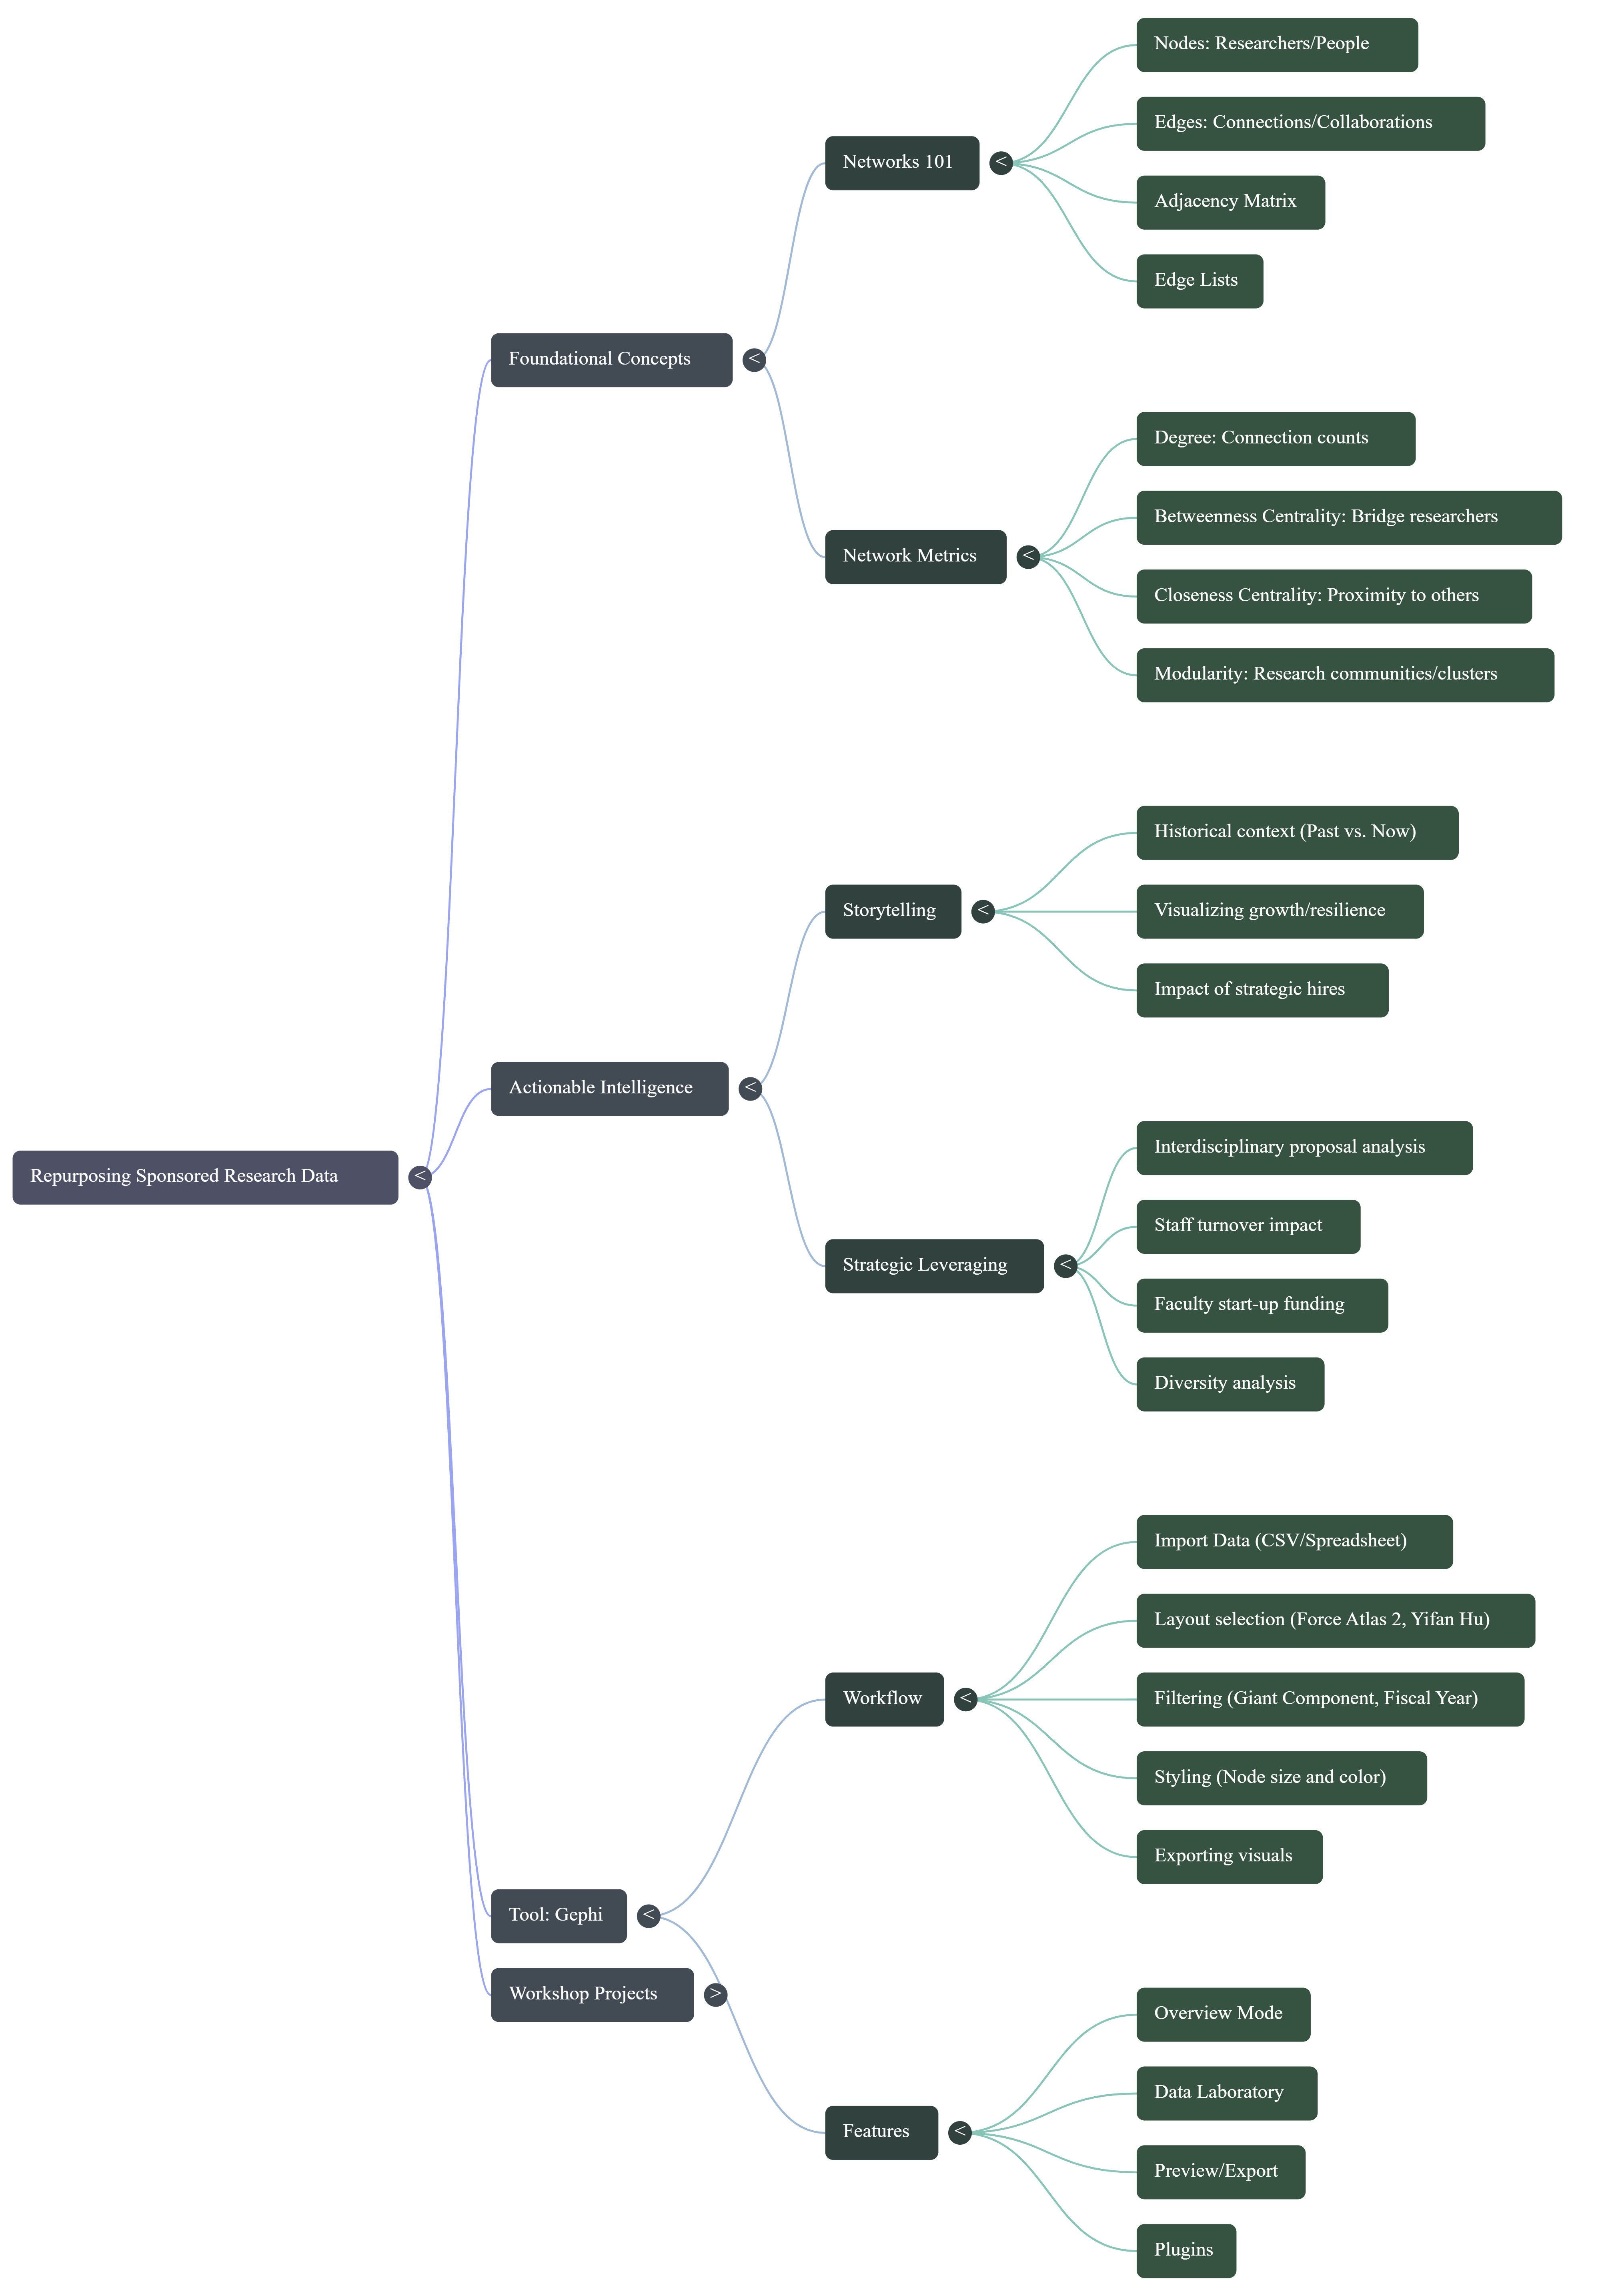
Workshop mind map  ·  the full session on one pageClick to expand →
Network Metrics

The vocabulary

Awareness-level coverage. You'll recognize these terms and what they mean when you see them in Gephi.

Degree (In/Out)

How many connections a person has. PI → Co-I is a directed network, so in-degree and out-degree differ.

Betweenness Centrality

How often someone sits on the shortest path between two other people. Identifies connectors between groups.

Closeness Centrality

Who is "closest" to everyone else. For each person, average the number of edges it takes to reach every other node.

Modularity

Analyzes all connections to determine groups. In our case, research clusters. We color nodes by modularity class to surface research teams.

Mapping Research Intelligence: From Spreadsheets to Collaboration Networks infographic
Resources

Materials

The shared folder contains the slide deck, Gephi, dummy proposal data, and interactive AI chatbots. Install Gephi before the workshop.

Your Presenter

Robert Pilgrim, Ph.D.

All thoughts shared in this workshop are the presenter's own and do not necessarily represent those of any affiliated institution.